DMI ADX Histogram Oscillator Forex Indicator Free Download: Powerful Strategy Guide for Smarter Trading

Introduction to DMI and ADX Indicators
Before diving into the histogram version, let’s understand the foundation.
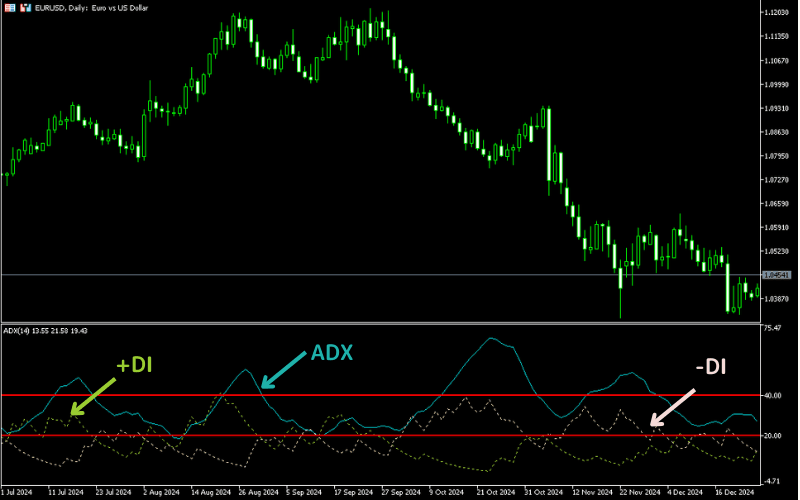
What Is the Directional Movement Index (DMI)?
The Directional Movement Index was developed by J. Welles Wilder. It measures the direction of price movement using two lines:
- +DI (Positive Directional Indicator)
- -DI (Negative Directional Indicator)
When +DI crosses above -DI, bullish pressure increases. When -DI crosses above +DI, bearish pressure dominates.
What Is the Average Directional Index (ADX)?
The ADX measures trend strength, not direction. A value:
- Above 25 = Strong trend
- Below 20 = Weak or ranging market
Together, DMI and ADX help traders understand both direction and strength.
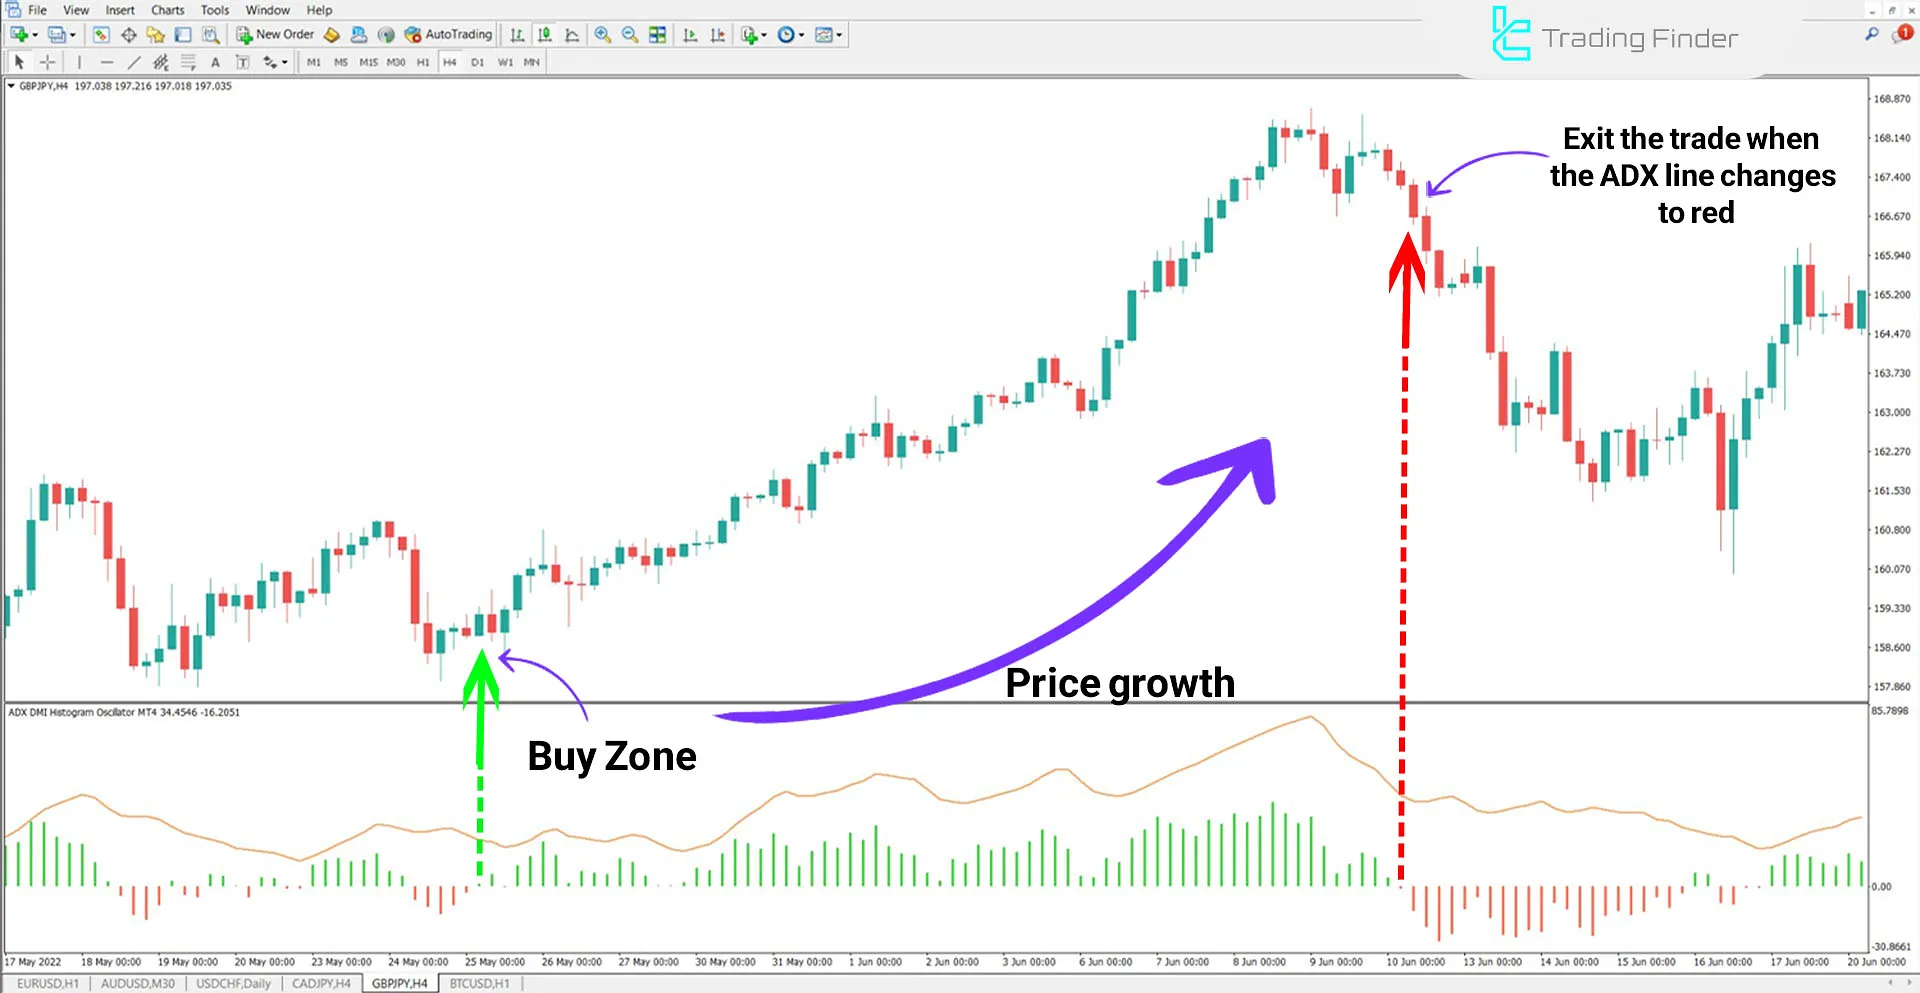
Understanding the DMI ADX Histogram Oscillator
The histogram version transforms traditional lines into vertical bars, making momentum easier to interpret.

4
How the Histogram Format Improves Visualization
Instead of watching three moving lines, traders see:
- Rising bars = Increasing trend strength
- Falling bars = Weakening trend
- Color changes = Directional shifts
This clean display reduces confusion and improves fast decision-making.
Key Components of the Indicator
- Histogram bars
- Zero level reference
- Optional color changes
- Adjustable ADX period
The simplicity makes it beginner-friendly while still powerful for professionals.
How the Indicator Calculates Trend Strength
Role of +DI and -DI Lines
Even though they may not be visible, the histogram internally calculates:
- Difference between +DI and -DI
- Strength measurement using ADX
When the positive difference grows, bullish bars expand. When negative pressure increases, bearish bars dominate.
ADX Smoothing Formula
The ADX uses a smoothed moving average formula to reduce noise. This filtering helps traders avoid reacting to minor price fluctuations.

Installing the Indicator on Trading Platforms
Most traders use MetaQuotes Software Corp platforms such as MetaTrader 4.
For official downloads and platform access, visit:
https://www.metatrader4.com
Installation on MetaTrader 4
- Download the .mq4 or .ex4 file
- Open MT4
- Click File → Open Data Folder
- Navigate to MQL4 → Indicators
- Paste the file
- Restart platform
- Drag indicator onto chart
Installation on MetaTrader 5
Steps are similar, but files go into the MQL5 → Indicators folder.
Best Settings for Different Trading Styles
Scalping Settings
- ADX Period: 7–10
- Timeframe: M5 or M15
- Combine with EMA 50
Shorter periods react faster but produce more signals.
Swing Trading Settings
- ADX Period: 14–20
- Timeframe: H1 or H4
- Combine with support/resistance levels
Longer settings reduce noise and improve reliability.
Trading Strategies Using the Indicator
Trend Continuation Strategy
- Wait for ADX histogram to rise above 25
- Confirm bullish or bearish direction
- Enter trade in direction of strong bars
- Place stop below recent swing
This strategy works best in trending markets.
Trend Reversal Strategy
- Look for histogram weakening
- Confirm divergence
- Wait for color shift
- Enter after candle confirmation
Patience is key here—false reversals are common.
Combining With Other Technical Indicators


4
Moving Averages
Use 50 EMA or 200 EMA to confirm overall trend. Only trade histogram signals aligned with MA direction.
RSI Confirmation
RSI above 50 confirms bullish momentum. Below 50 confirms bearish conditions.
Advantages of Using the Histogram Version
- Easier visual interpretation
- Faster decision-making
- Less chart clutter
- Better momentum spotting
- Ideal for beginners
It simplifies traditional DMI complexity without removing its power.
Limitations and Common Mistakes
No indicator is perfect. Here’s what to watch:
- Lagging nature (based on past data)
- False signals in ranging markets
- Overtrading during consolidation
- Ignoring higher timeframe trend
Always confirm with price action.
Risk Management Techniques
Even with the best tool, risk management matters.
- Risk only 1–2% per trade
- Use stop-loss orders
- Avoid trading during major news
- Diversify currency pairs
Discipline protects your capital.
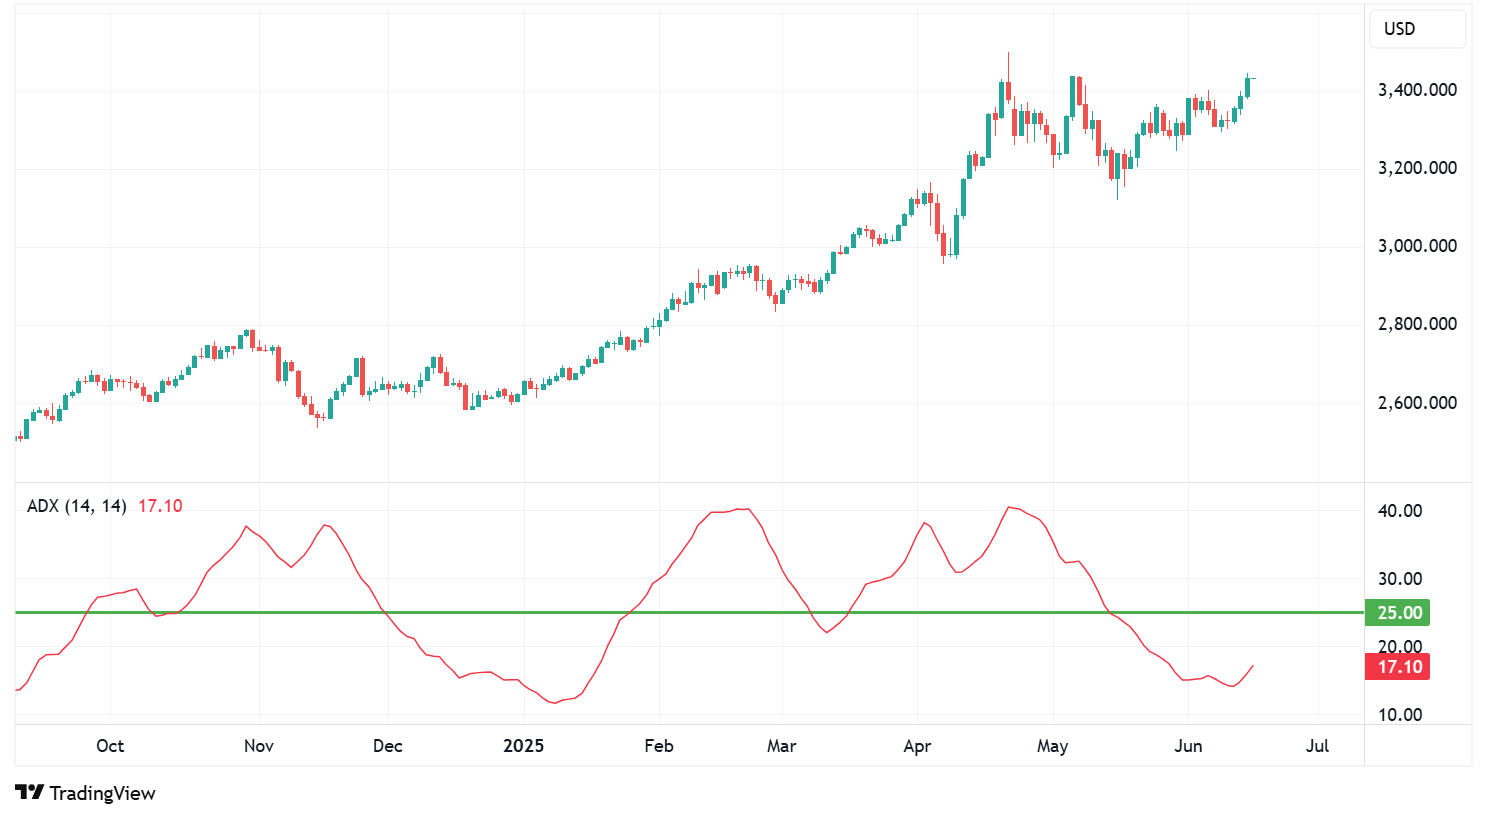
Real Market Example and Chart Explanation


4
In a strong EUR/USD uptrend:

Powerful Forex VPS for MT4 & MT5 – Best Price
In stock
$44.99 $359.99Price range: $44.99 through $359.99| Validity | Monthly, Quarterly, Semi Annually, Annually |
|---|
- Histogram rises steadily above 25
- Pullbacks show slight weakening
- Trend resumes as bars expand again
This pattern signals healthy continuation momentum.
Frequently Asked Questions (FAQs)
1. Is the DMI ADX Histogram Oscillator suitable for beginners?
Yes. The histogram format simplifies complex trend analysis.
2. What timeframe works best?
It works on all timeframes, but H1 and H4 provide more reliable signals.
3. Can it be used for crypto trading?
Yes, it works on any market with price data.
4. Does it repaint?
Most versions do not repaint once a candle closes.
5. What is the ideal ADX level for entry?
Above 25 indicates a strong trend.
6. Can I use it alone?
It’s better combined with price action or moving averages.
Conclusion and Final Thoughts
The DMI ADX Histogram Oscillator Forex Indicator Free Download offers traders a powerful way to measure trend strength without cluttering their charts. By transforming traditional DMI and ADX calculations into an easy-to-read histogram, it enhances clarity and speeds up decision-making.
However, remember this: no tool guarantees profit. Success comes from combining strong indicators with discipline, patience, and risk management.
If used correctly, this indicator can become a reliable part of your Forex trading system and help you navigate trends with greater confidence.
Most Popular Forex EA


Onix Stratos XAUUSD EA: AI Smart Scalper for MT5
In stock
$0.00 $999.99Price range: $0.00 through $999.99

Elysium Vortex EURCAD EA: AI EURCAD Scalper for MT5
In stock
$0.00 $199.99Price range: $0.00 through $199.99
Equinox Cosmos GBPJPY EA: AI GBPJPY Scalper for MT5
In stock
$0.00 $399.99Price range: $0.00 through $399.99

Apex Quant BTCUSD EA: AI Bitcoin Scalper for MT5
In stock
$0.00 $159.99Price range: $0.00 through $159.99

Zenith Matrix XAUUSD EA: AI Gold Scalper for MT5
In stock
$0.00 $899.99Price range: $0.00 through $899.99

Nexora Manus XAUUSD EA: AI Gold Scalper for MT5
In stock
$0.00 $699.99Price range: $0.00 through $699.99
Mythos Epic XAUUSD EA: AI Gold Scalper for MT5
In stock
$0.00 $849.99Price range: $0.00 through $849.99

Obsidian Aether EURUSD EA: AI Grid Scalper for MT5
In stock
$0.00 $797.99Price range: $0.00 through $797.99

AVA AIGPT5 XAUUSD EA: AI Gold Scalper for MT4
In stock
$0.00 $679.99Price range: $0.00 through $679.99


Golden Deer Holy Grail Indicator (Lifetime Premium)
In stock
Original price was: $109.99.$87.99Current price is: $87.99.
Powerful Forex VPS for MT4 & MT5 – Best Price
In stock
$44.99 $359.99Price range: $44.99 through $359.99

 Gold Forex EA