Scalping has become an increasingly popular trading strategy, especially with the rise of automated trading systems known as Expert Advisors (EAs). Scalping EAs are programmed to open and close trades within minutes or even seconds to capture small profits repeatedly throughout the day. But is using scalping EAs an effective trading approach or just risky business? This comprehensive guide examines the pros and...
Scalping is a fast-paced trading strategy that involves rapidly opening and closing trades to capture small profits. Scalpers aim to make many trades throughout the day, holding positions for just seconds or minutes. While scalping requires focus and lightning-fast execution, it can be an effective strategy for active traders looking to profit from short-term market moves.
In this comprehensive guide,...
The London trading session is one of the most volatile and active periods for forex trading. The London breakout strategy aims to capitalize on the increased volatility during the first few hours when the London session opens. This simple yet effective strategy focuses on trading breakouts from the opening range of the London session.
What is the London Breakout Strategy?
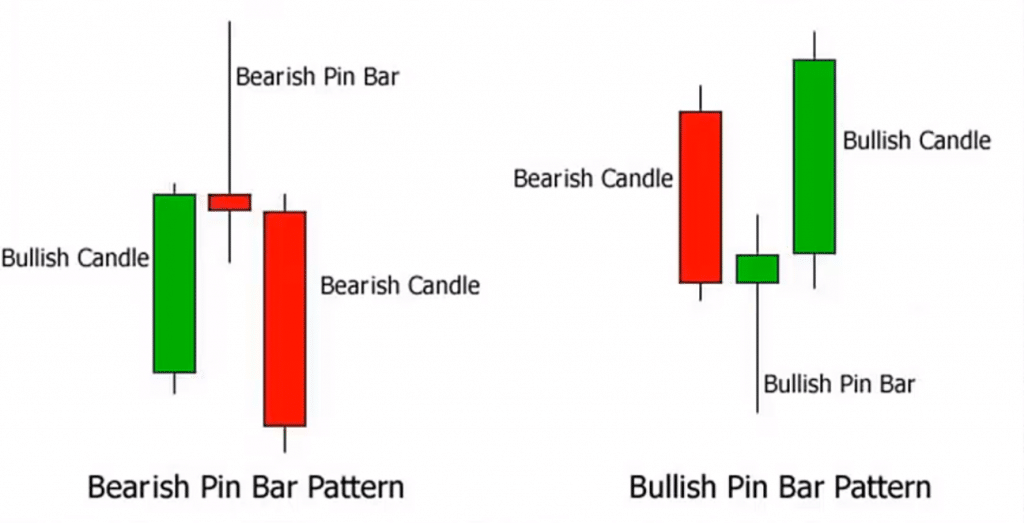
Pin bars are one of the most common and powerful price action trading strategies. A pin bar forms when price moves sharply during a candle, but by the close has returned close to the open. This "tail" that gets left behind provides traders with valuable information about the market.
In this comprehensive guide, we will cover everything you need to...
Volume Spread Analysis (VSA) is a powerful trading technique that identifies imbalances between volume, price and spread to understand the current market context. VSA provides a unique market perspective to spot high-probability trading opportunities.
In this comprehensive guide, we explain what Volume Spread Analysis is, its origins, key principles, how it works, techniques, strategies and tools to trade with VSA...
The London Breakout is a popular forex day trading strategy used by traders to capitalize on the high volatility during the London market open. This strategy aims to catch breakouts from key support and resistance levels as increased volume from London traders causes prices to break out of recent ranges.
In this comprehensive guide, we’ll explain what the London Breakout...
Zone trading is a unique technical analysis approach that aims to identify supply and demand levels in a stock's price action. It involves dividing a stock's price movement into different "zones" and analyzing how the stock behaves within each zone. Zone trading provides traders with a structured framework to determine potential support, resistance, and breakout levels.
An Introduction to Zone...
A forex cheat sheet is a concise guide that provides traders with important information and key currency pairs' historical and current values, allowing them to make informed decisions quickly and efficiently. With a quick glance, traders can easily see the exchange rates, trend patterns, and other relevant market data they need for successful forex trading.
In the fast-paced world of...
The elliott wave indicator is a tool used in technical analysis to identify market trends and potential reversal points. It is based on the theory that markets move in repetitive cycles of five waves in the direction of the trend, followed by three corrective waves.
Traders use this indicator to anticipate future price movements and make informed trading decisions. With...
Double tops in forex are a bearish reversal pattern formed by two peaks at approximately the same level, followed by a downward move. This pattern suggests a potential trend reversal and provides traders with a sell signal when the price breaks below the neckline.
Double tops are commonly used in technical analysis as they indicate a shift from buying to...
Technical traders look for any edge they can get in the financial markets. One tool that has stood the test of time is the Fibonacci retracement. Fibonacci retracement levels help traders identify potential support and resistance levels, allowing them to better time entries and exits. In this comprehensive guide, we’ll explain what Fibonacci retracements are, how they work, and how to use them...
Scalping trading has emerged as one of the most popular short-term trading strategies. This fast-paced approach attempts to make small profits on minor price changes consistently throughout the day. With the right skills, insights, and discipline, traders can make a living off scalping despite its challenges.
This comprehensive guide will explore every aspect of scalping to help you understand how...