SMI Ergodic Oscillator Indicator Free Download: Powerful & Proven Trading Edge


Introduction to the SMI Ergodic Oscillator Indicator Free Download
The SMI Ergodic Oscillator Indicator Free Download has become one of the most searched trading tools among forex, crypto, and stock traders. Why? Because it combines trend-following power with momentum precision.
If you’re looking for a reliable oscillator that helps detect trend reversals, confirm entries, and filter false signals, you’re in the right place. This guide explains everything—from how it works to how you can use it effectively.
What Is the SMI Ergodic Oscillator?
The SMI Ergodic Oscillator is a momentum indicator derived from the True Strength Index (TSI). It measures price movement strength and direction.
Unlike traditional oscillators, it smooths price data twice, reducing noise and giving clearer signals. That means fewer fake breakouts and better trend confirmation.
Why Traders Search for SMI Ergodic Oscillator Indicator Free Download
Many traders want the SMI Ergodic Oscillator Indicator Free Download because:
- It’s free and easy to install.
- It works across multiple platforms.
- It provides clear crossover signals.
- It’s effective in trending markets.
- It helps detect divergences.
And let’s be honest—who doesn’t want a powerful tool without paying hefty subscription fees?
How the SMI Ergodic Oscillator Works
Mathematical Formula Explained Simply
The indicator calculates momentum using:
- Double-smoothed price change
- Double-smoothed absolute price change
- Ratio of both values
- Signal line (EMA of the oscillator)
Don’t worry—you don’t need to calculate it manually. The platform does it automatically.
What matters is how you interpret the output.
Signal Line & Histogram Interpretation
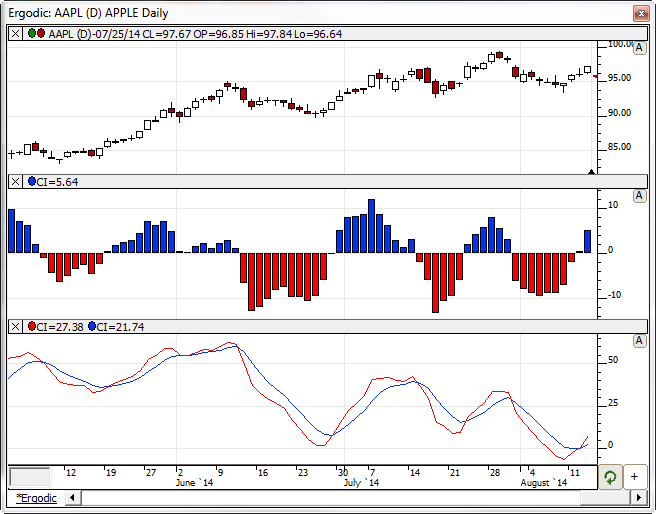

The SMI Ergodic Oscillator typically shows:
- Main Line
- Signal Line
- Optional Histogram
Key signals:
- 🔵 Bullish Signal: When the main line crosses above the signal line.
- 🔴 Bearish Signal: When the main line crosses below the signal line.
- 📉 Divergence: Price makes new highs, but indicator doesn’t.
Difference Between SMI and MACD
| Feature | SMI Ergodic | MACD |
|---|---|---|
| Double smoothing | Yes | No |
| Noise reduction | High | Medium |
| Sensitivity | Moderate | High |
| Best for | Trend confirmation | Momentum shifts |
SMI is often considered a smoother, cleaner version of MACD.

Key Features of the SMI Ergodic Oscillator
Momentum Detection
It measures how strong a move is. Strong momentum = stronger signals.
Trend Confirmation
When both lines stay above zero, the trend is bullish. Below zero? Bearish.
Overbought and Oversold Signals
Although not its primary use, extreme readings can hint at potential reversals.
Best Settings for Different Markets
Forex Trading Setup
- Short EMA: 5
- Long EMA: 20
- Signal: 5
Works well on 1H and 4H charts.
Stock Market Setup
- Short EMA: 10
- Long EMA: 30
- Signal: 5
Best for swing trading.
Crypto Market Setup
Crypto is volatile. Try:
- Short EMA: 5
- Long EMA: 35
- Signal: 5
Adjust based on volatility.
How to Install SMI Ergodic Oscillator
Installation on MetaTrader 4/5
- Download the indicator file (.mq4 or .ex4).
- Open MT4 → File → Open Data Folder.
- Paste file in “Indicators” folder.
- Restart platform.
Installation on TradingView


4
On TradingView:
- Open chart.
- Click “Indicators.”
- Search “SMI Ergodic.”
- Add to chart.
You can also browse community scripts at:
https://www.tradingview.com
Trading Strategies Using SMI Ergodic Oscillator
Crossover Strategy
- Buy: Main line crosses above signal below zero.
- Sell: Main line crosses below signal above zero.
Best used in trending markets.
Divergence Strategy
If price makes higher highs but SMI makes lower highs—watch for reversal.
This strategy works great on daily charts.
Trend-Following Strategy
Combine with:
- 200 EMA
- Support & resistance
Only take buy signals above 200 EMA.
Advantages and Limitations
Benefits for Beginners
- Easy to understand
- Clear signals
- Works on multiple timeframes
- Free to use
Common Mistakes to Avoid
- Trading in sideways markets
- Ignoring risk management
- Using default settings blindly
- Entering before candle confirmation
Risk Management with SMI Indicator
No indicator is perfect. Always:
- Risk 1–2% per trade.
- Use stop-loss.
- Avoid overtrading.
- Confirm with price action.
Remember: The indicator confirms; price leads.
Frequently Asked Questions (FAQs)
1. Is SMI Ergodic Oscillator better than MACD?
It depends on strategy. SMI is smoother and filters noise better.
2. Is the SMI Ergodic Oscillator Indicator Free Download really free?
Yes, many platforms offer it for free. Always download from trusted sources.
3. What timeframe works best?
1H, 4H, and Daily charts are most reliable.
4. Can beginners use it?
Absolutely. It’s beginner-friendly but requires practice.
5. Does it repaint?
No, standard versions do not repaint.
6. Can it be used for scalping?
Yes, but adjust settings for lower timeframes.
Final Thoughts & Conclusion
The SMI Ergodic Oscillator Indicator Free Download offers traders a powerful momentum-based tool that’s easy to use and highly effective when combined with solid strategy and risk management.
It’s not magic. But when used correctly, it can significantly improve your entry timing and trend confirmation.
If you’re serious about trading success, test it on a demo account first. Adjust settings, understand behavior, and combine it with price action.
Because in trading, discipline beats indicators every time.


Most Popular Forex EA


Apex Quant BTCUSD EA: AI Bitcoin Scalper for MT5
In stock
$0.00 $159.99Price range: $0.00 through $159.99

AVA AIGPT5 XAUUSD EA: AI Gold Scalper for MT4
In stock
$0.00 $679.99Price range: $0.00 through $679.99

Elysium Vortex EURCAD EA: AI EURCAD Scalper for MT5
In stock
$0.00 $199.99Price range: $0.00 through $199.99
Equinox Cosmos GBPJPY EA: AI GBPJPY Scalper for MT5
In stock
$0.00 $199.99Price range: $0.00 through $199.99


Golden Deer Holy Grail Indicator (Lifetime Premium)
324 in stock
Original price was: $1,861.99.$187.99Current price is: $187.99.

Mythos Epic XAUUSD EA: AI Gold Scalper for MT5
In stock
$0.00 $849.99Price range: $0.00 through $849.99

Nexora Manus XAUUSD EA: AI Gold Scalper for MT5
In stock
$0.00 $699.99Price range: $0.00 through $699.99

Obsidian Aether EURUSD EA: AI Grid Scalper for MT5
47 in stock
$0.00 $797.99Price range: $0.00 through $797.99
Powerful Forex VPS for MT4 & MT5 – Best Price
182 in stock
$44.99 $359.99Price range: $44.99 through $359.99

Top 2000 Trading Tools for Forex Success (EA & Indicator)
In stock
Original price was: $9,999.99.$0.00Current price is: $0.00.

Zenith Matrix XAUUSD EA: AI Gold Scalper for MT5
In stock
$0.00 $899.99Price range: $0.00 through $899.99 Gold Forex EA