RSI on MA Indicator Free Download: Powerful & Proven Strategy Guide

If you’re searching for RSI on MA Indicator Free Download, you’re likely looking for a smarter way to filter trading signals and reduce false entries. Good news—you’re in the right place.
The RSI on MA Indicator combines two powerful technical analysis tools into one refined system. By applying a Moving Average (MA) to the Relative Strength Index (RSI), traders get smoother signals and clearer trend confirmation. Let’s break it down in simple, practical terms.
What Is the RSI on MA Indicator?
The RSI on MA Indicator is a modified version of the classic RSI oscillator. Instead of using raw RSI values, it applies a moving average over the RSI line to smooth out market noise.
In short:
RSI measures momentum.
MA smooths data.
RSI on MA combines both for better accuracy.
Understanding RSI (Relative Strength Index)
The Relative Strength Index was developed by J. Welles Wilder. It measures the speed and change of price movements on a scale from 0 to 100.
- Above 70 → Overbought
- Below 30 → Oversold
- Around 50 → Neutral trend
However, standard RSI can be noisy in volatile markets.
Understanding Moving Average (MA)
A Moving Average smooths price data over a selected period.
Common types:
- Simple Moving Average (SMA)
- Exponential Moving Average (EMA)
- Weighted Moving Average (WMA)
When applied to RSI values, it removes sudden spikes and produces clearer signals.
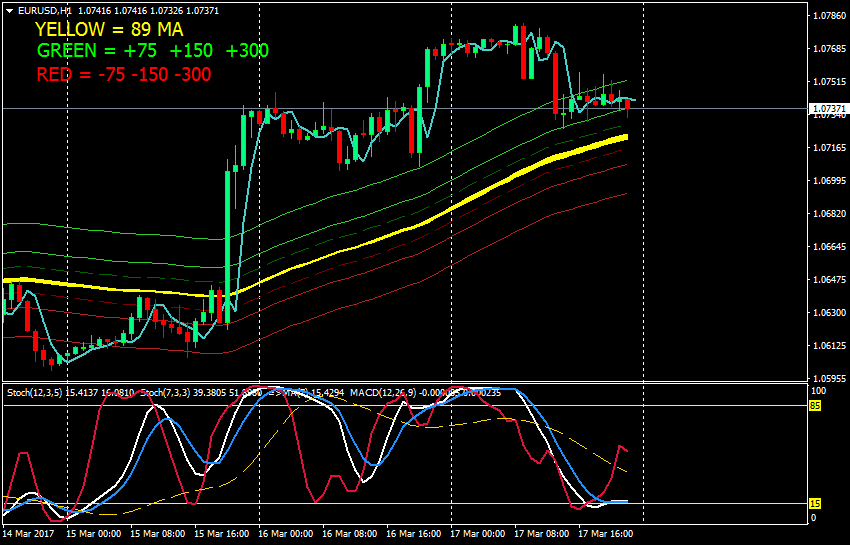
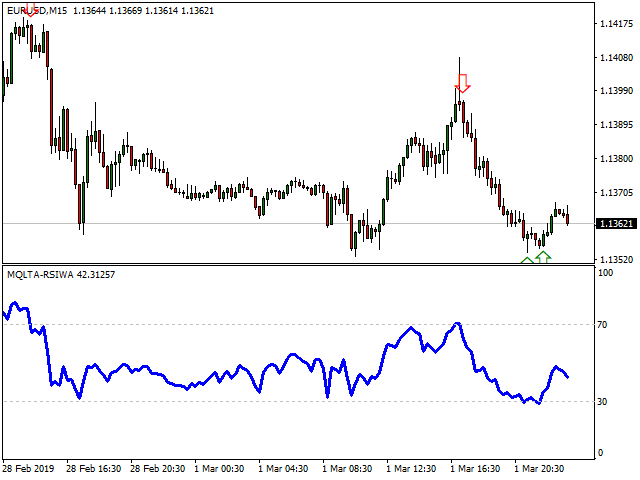
How the RSI on MA Indicator Works
The RSI on MA indicator calculates RSI first. Then it applies a moving average to that RSI line.
This creates:
- A smoothed RSI curve
- A signal line for crossovers
- More reliable trend identification
Formula Structure Explained
Step 1: Calculate RSI (usually 14-period).
Step 2: Apply MA (often 9-period EMA) to RSI.
Step 3: Generate signals from crossovers.
Signal Line Crossovers
- RSI crossing above MA → Bullish signal
- RSI crossing below MA → Bearish signal
- Cross near 30 → Strong buy zone
- Cross near 70 → Strong sell zone
Simple. Clear. Effective.
Key Features of RSI on MA Indicator
Here’s why traders love it:
- ✅ Custom RSI period settings
- ✅ Adjustable MA type (SMA, EMA, WMA)
- ✅ Alert notifications
- ✅ Multi-timeframe compatibility
- ✅ Works on forex, stocks, crypto
It’s especially popular on platforms like MetaTrader 4, MetaTrader 5, and TradingView.

Benefits of Using RSI on MA Indicator
Why not just use standard RSI?
Because smoothing reduces fake signals.
Here’s what improves:
- 📉 Fewer whipsaws
- 📊 Clearer trend direction
- ⏱ Better timing for entries
- 💡 Improved confidence in trades
It acts like a filter—blocking unnecessary noise.
RSI on MA Indicator Free Download Options
You can find the RSI on MA Indicator Free Download for major platforms.
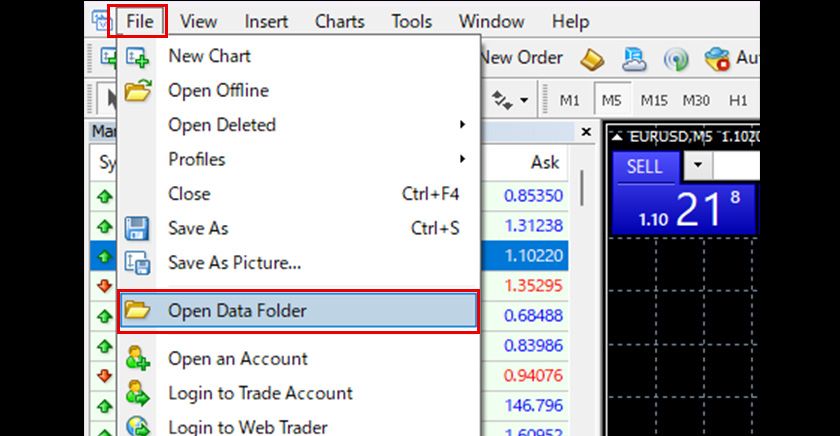
MetaTrader 4 (MT4)
4
MT4 is one of the most widely used trading platforms.
Steps:
- Download the .mq4 or .ex4 file
- Open MT4 → File → Open Data Folder
- Go to MQL4 → Indicators
- Paste file
- Restart platform
The indicator will appear under “Custom Indicators.”
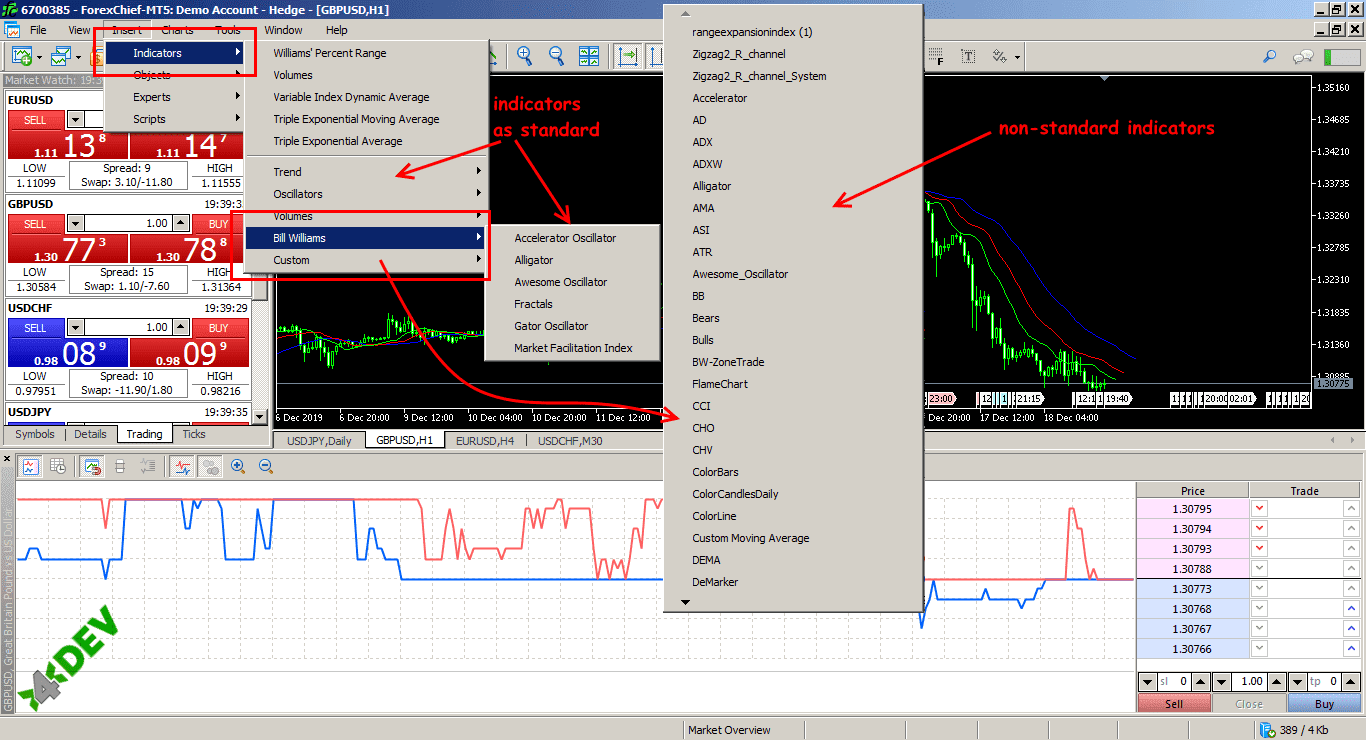
MetaTrader 5 (MT5)

4
MT5 uses the MQL5 folder instead of MQL4. The process is almost identical.
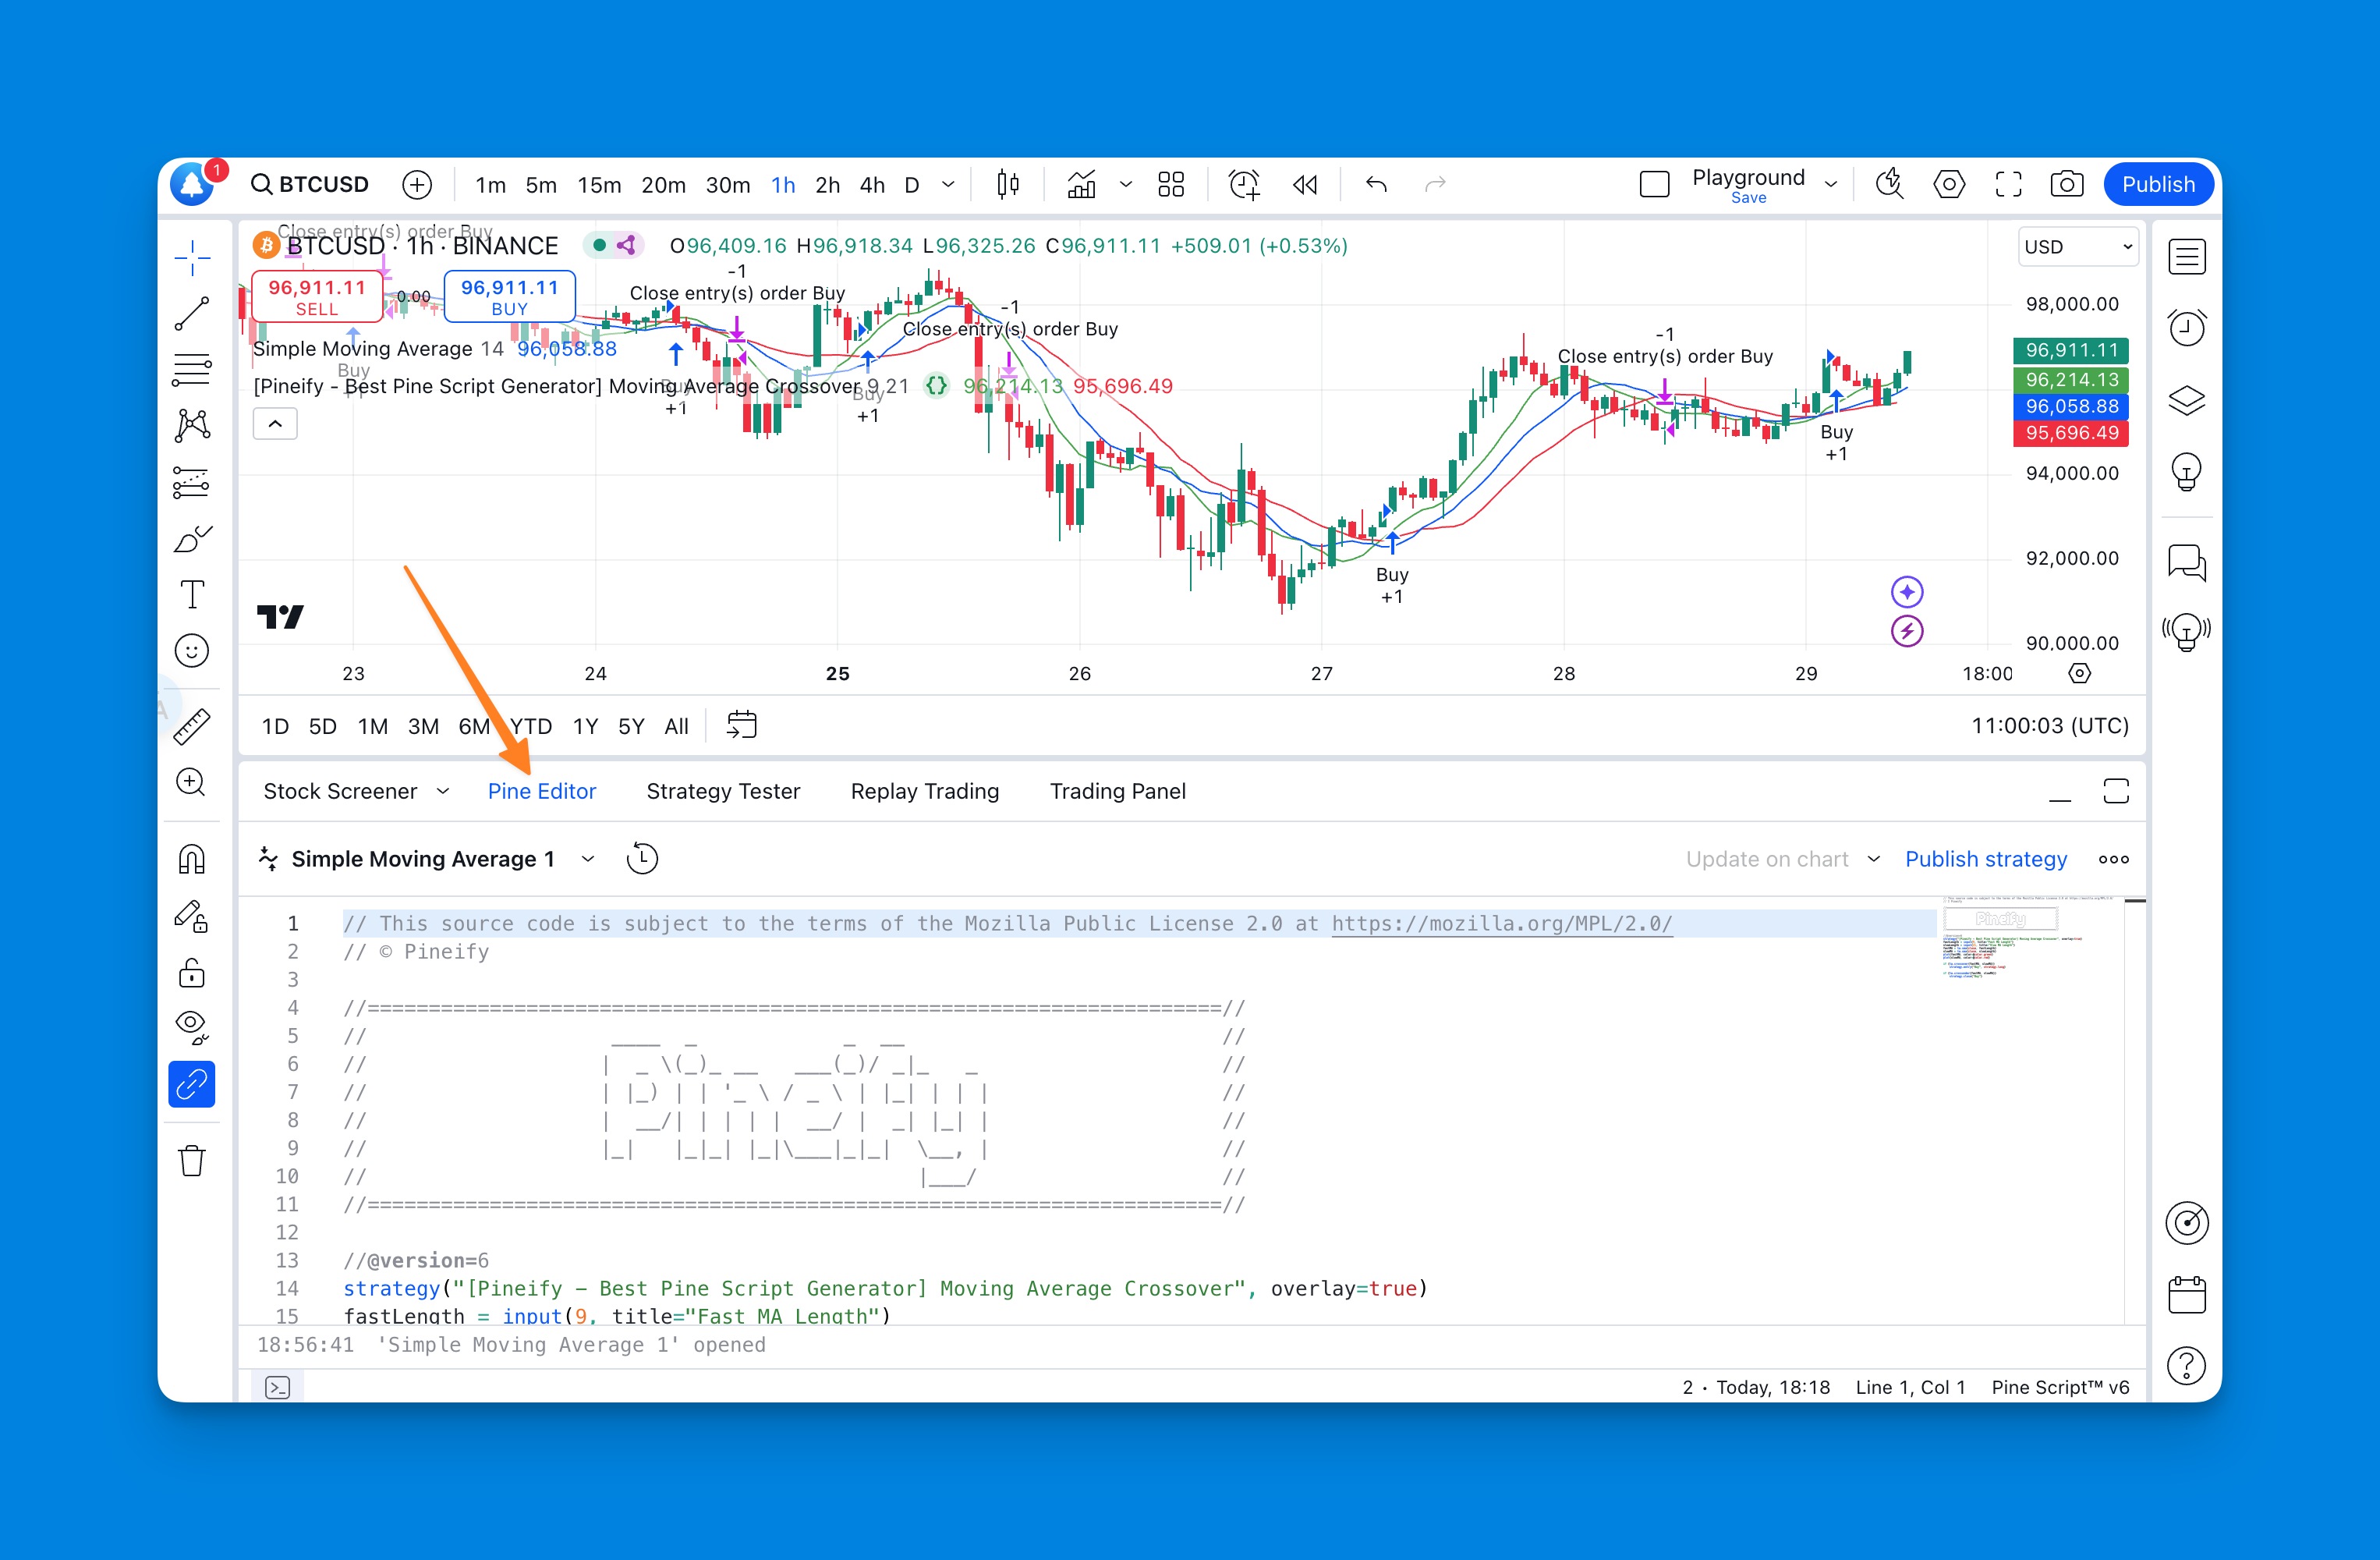
TradingView Version


4
On TradingView:
- Search public scripts
- Or create via Pine Script
- Add RSI
- Apply moving average to RSI source
You can explore community scripts at:
https://www.tradingview.com/scripts/
Step-by-Step Installation Guide
Here’s a quick checklist:
| Step | Action |
|---|---|
| 1 | Download indicator file |
| 2 | Scan file for viruses |
| 3 | Place in correct Indicators folder |
| 4 | Restart platform |
| 5 | Adjust settings |
Always download from reputable trading forums or verified developer pages.
Best Settings for RSI on MA Indicator
Different styles need different settings.
Scalping
- RSI: 7
- MA: 5 EMA
- Timeframe: 1M–5M
Day Trading
- RSI: 14
- MA: 9 EMA
- Timeframe: 15M–1H
Swing Trading
- RSI: 21
- MA: 14 SMA
- Timeframe: 4H–Daily
Trading Strategies Using RSI on MA
Trend Confirmation Strategy
- Identify trend with 200 MA
- Wait for RSI to cross above MA in uptrend
- Enter on confirmation candle
Works best in trending markets.
Overbought/Oversold Reversal Strategy
- RSI below 30
- RSI crosses above MA
- Enter buy
- Opposite for sell near 70
Simple but powerful when combined with support/resistance.
Common Mistakes to Avoid
- ❌ Using default settings blindly
- ❌ Ignoring higher timeframe trend
- ❌ Over-optimizing parameters
- ❌ Trading during major news events
Remember, no indicator guarantees profits.
RSI on MA vs Standard RSI
| Feature | Standard RSI | RSI on MA |
|---|---|---|
| Noise Level | High | Low |
| Signal Clarity | Moderate | High |
| False Signals | More frequent | Reduced |
| Best For | Quick momentum | Confirmed entries |
Is RSI on MA Indicator Safe to Download?
Yes—if you download from reputable sources.
Avoid:
- Suspicious websites
- Unknown executable files
- Indicators asking for login credentials
Always scan files before installing.
Frequently Asked Questions
1. Is RSI on MA Indicator Free Download really free?
Yes, many developers offer it free for MT4, MT5, and TradingView.
2. Can beginners use this indicator?
Absolutely. It’s simple and beginner-friendly.
3. Does it work for crypto?
Yes, it works on forex, stocks, indices, and crypto.
4. What timeframe is best?
It depends on your strategy. 15M to 1H is popular.
5. Is RSI on MA better than MACD?
It’s different. The MACD focuses on convergence/divergence, while RSI on MA filters momentum signals.
6. Can I combine it with other indicators?
Yes. Many traders combine it with volume, support/resistance, or trendlines.
Final Thoughts
The RSI on MA Indicator Free Download offers a smarter way to trade momentum. By smoothing RSI with a moving average, it reduces noise and increases signal clarity. Whether you’re scalping or swing trading, this hybrid tool can significantly improve your decision-making process.
However, remember—indicators are tools, not magic formulas. Always combine them with proper risk management and market analysis.


Apex Quant BTCUSD EA: AI Bitcoin Scalper for MT5
In stock
$0.00 $999.99Price range: $0.00 through $999.99

AVA AIGPT5 XAUUSD EA: AI Gold Scalper for MT4
In stock
$0.00 $679.99Price range: $0.00 through $679.99

Equinox Cosmos GBPJPY EA: AI GBPJPY Scalper for MT5
In stock
$0.00 $599.99Price range: $0.00 through $599.99


Golden Deer Holy Grail Indicator (Lifetime Premium)
324 in stock
Original price was: $1,861.99.$187.99Current price is: $187.99.

Mythos Epic XAUUSD EA: AI Gold Scalper for MT5
In stock
$0.00 $849.99Price range: $0.00 through $849.99

Nexora Manus XAUUSD EA: AI Gold Scalper for MT5
In stock
$0.00 $499.99Price range: $0.00 through $499.99
Powerful Forex VPS for MT4 & MT5 – Best Price
182 in stock
$44.99 $359.99Price range: $44.99 through $359.99

Top 2000 Trading Tools for Forex Success (EA & Indicator)
In stock
Original price was: $9,999.99.$0.00Current price is: $0.00.

Zenith Matrix XAUUSD EA: AI Gold Scalper for MT5
In stock
$0.00 $899.99Price range: $0.00 through $899.99